Statistics Blog
Line Graphs
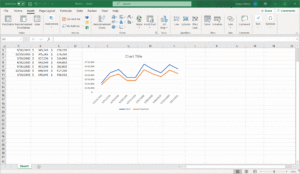
April 1st, 2023 by BoxplotWhat Is A Line Graph? A line graph is a series of data points on an x–y axis, connected by a line. There are two kinds of line graphs: colored-in (also known as area charts) and standard. While the area under the line of a colored-in line graph is shaded in, the area under a standard line […]
Tips For Building Likert Surveys
April 1st, 2023 by BoxplotLikert Surveys ―pronounced LICK-ert― are one of the most popular ways of collecting survey data. Their simple design of providing a series of prompts with a discrete scale of responses for each prompt (such as “Strongly Disagree”, “Disagree”, “Neutral”, “Agree”, and “Strongly Agree”; “Poor”, “Fair”, “Average”, “Good”, and “Excellent”, etc.) makes Likert Surveys an extremely popular […]
A/B Testing Example (Two Proportion Hypothesis Test)
September 25th, 2019 by BoxplotA/B testing (sometimes called split testing) is comparing two versions of a web page, email newsletter, or some other digital content to see which one performs better. A company will compare two web pages by showing the two variants (let’s call them A and B) to similar visitors at the same time. Typically, the company […]

Population Mean Hypothesis Test Example
September 25th, 2019 by BoxplotThe Situation: Kakes+, a Pennsylvania company that makes terribly unhealthy small pies/cakes, believes that their machines are overfilling their blueberry pies. Kakes+ wants to test this statistically, and has recruited you to come up with a data-backed answer. The pies should weigh 8 ounces each. Step 1: Collect Data You need to weigh the pies […]
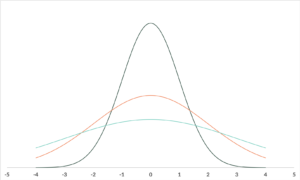
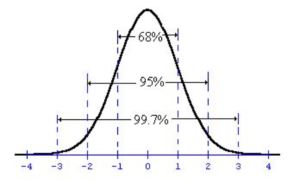
100th Anniversary of Variance
December 28th, 2018 by BoxplotThis year (2018) is the 100th anniversary of a paper by R. A. Fisher, which introduced the statistical term “variance”. Variance is one of the toughest concepts in statistics, but it’s crucially important. Variance tells you how spread out your data are (yep, “are”; the word “data” is plural!). First, let’s get some terminology out of […]
