PivotTables in Excel
PivotTables in Excel
by Boxplot Feb 1, 2021
What is a PivotTable?
A Pivot Table is an analytics tool that can quickly answer key business questions. They are excellent at extracting insights from a vast dataset quickly. PivotTables are one of the most efficient and effective ways to evaluate large quantities of data in Excel. By “pivoting” or aggregating a large data table into a condensed, visually appealing format, PivotTables reveal key information that would not be visible by looking at the raw data.
Example
The Lemonade Stand is a timeless example of operating a successful business-illuminating the importance of intelligent marketing, pricing, and financial decisions. It doesn’t matter if you are the CEO or just started yesterday; we’re going to highlight what a Pivot Table can do for your business.
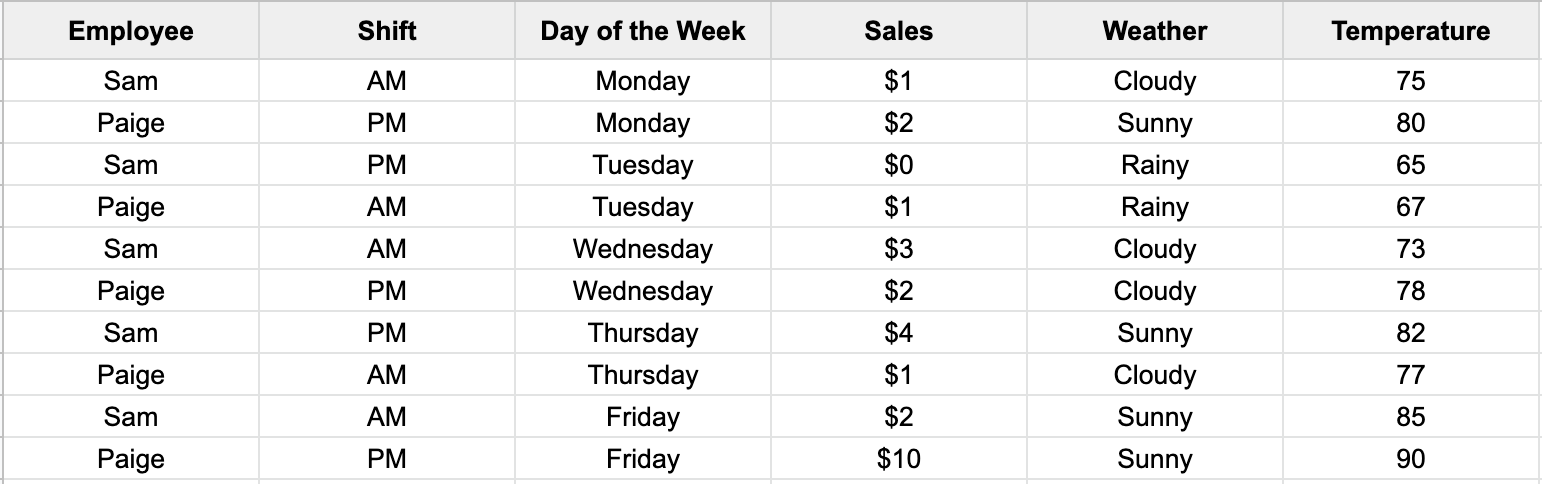
Fortunately, the lemonade data above is formatted correctly. In this case, select your preference for either Excel or Google Sheets, and follow the video to create a Pivot Table.
The 4 Areas of a Pivot Table:
You should see an empty Pivot Table. Your business question will determine which fields (Employee, Shift, Day of the Week, Sales, Weather, Temperature) you want to include. To help decide, we also need to understand the four areas of a Pivot Table.The 4 areas are Columns, Rows, Values, and Filters:
Columns – This will create a list of all of the unique values in the field you choose, going horizontally across the page.
Rows – This will create a list of all of the unique values in the field you choose, going vertically down the page.
Values – The field that you want to measure in your Pivot Table, aggregated based on what is in the Rows and Columns boxes. For example, sum of Sales, count of Employees, average of Temperature. Typically a numeric field, but not always.
Filters – You can filter the entire PivotTable using whatever fields you put in here. For example, a filter on Weather allows you to display sales of only the sunny days.
Examples:
- Let’s say our lemonade venture wants to see our sum of Sales across the Day of the Week for each Employee. Select your preference for either Excel or Google Sheets, and follow the video to create this Pivot Table.
- Furthermore, let’s say our lemonade venture wants to filter these Sales for when the Temperature is over 70 degrees. The filter area allows us to do this. For a bonus, we will add some conditional formatting.
Data Formatting for a Pivot Table
If the tutorial above was a walk in the park, but you still haven’t created a pivot table, the problem is most likely the formatting of your data. This section will discuss data formatting and data cleaning issues that may prevent you from creating a Pivot Table.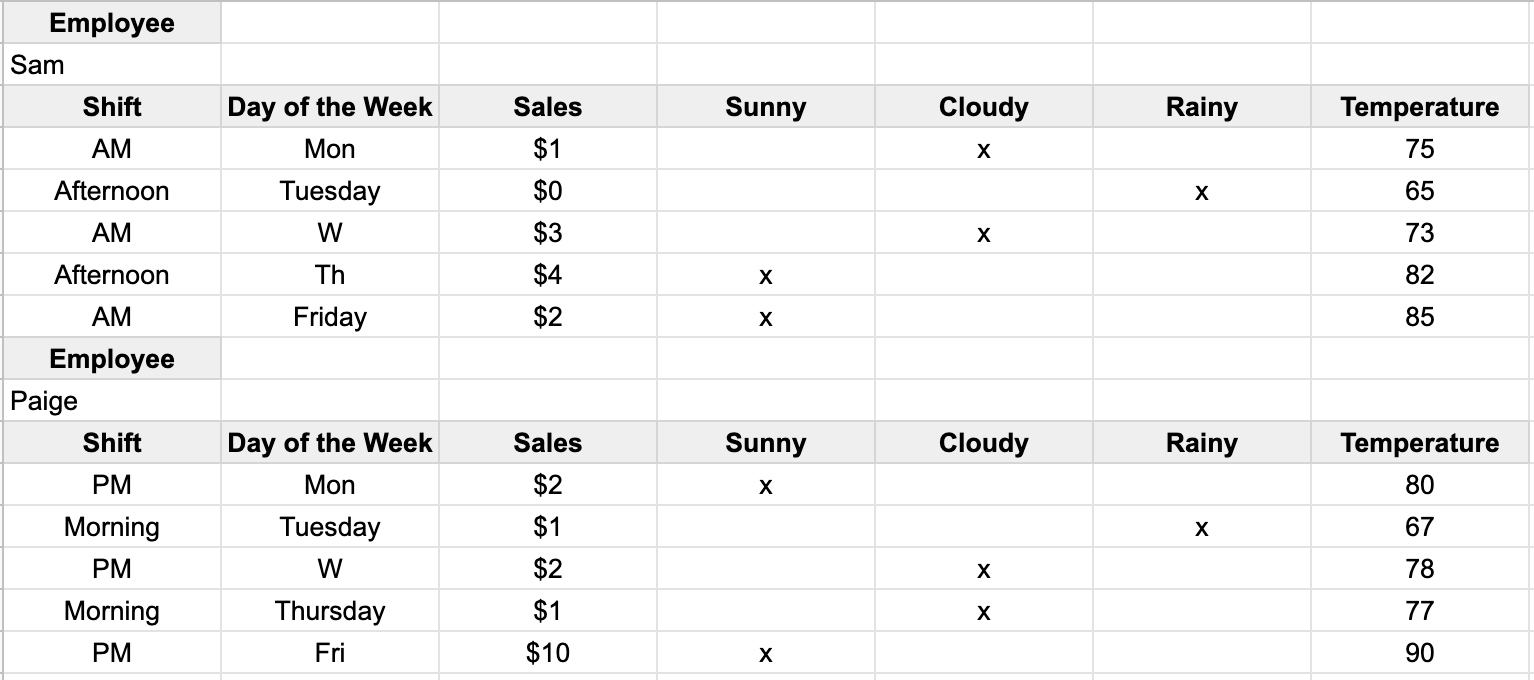
Multiple Data Sources:
Sometimes it is the case that data is collected separately in different sheets or workbooks. Referring to the example above, it could be the case that the data was collected independently for each employee. Following the general rule that all values of the same type need to be in one column would solve this issue. A little copy and paste would accomplish this.Data Structure:
Separately, there is the issue that the weather data (Sunny, Cloudy, Rainy) was collected such that each type of Weather is a column. This column structure is also known as unstacked data or wide data, which can be preferred when modeling. However, for visualizations such as Pivot Tables, it is best to move these (Sunny, Cloudy, Rainy) under one column, so it is stacked data or long data.Dirty Data:
So far, we have assumed that each cell’s data has been correctly filled out. In other words, the focus has been on the overall structure of the data or the columns. However, when working on real-world problems, it is most often the case that you have some dirty data. For example, the dates are spelled differently. For this example, it is quite trivial to fix this issue, but when your spreadsheet contains thousands or millions of rows, data cleaning can be tremendously time-consuming. Additionally, we have not covered the importance of number of formats in Excel and Google Sheets. In the video examples above, the Days of Weeks are ordered correctly. Depending on the spreadsheet, sometimes this happens automatically, but sometimes the number format of your data can cause Pivot Table display issues.Final Remarks
Hopefully, you found this post useful. If you have questions on pivot tables or drawing conclusions based on the observations from a pivot table you have already created, Boxplot is well versed in data visualizations and statistics. Furthermore, if you are spending valuable time trying to structure, clean, or format your data, please don’t hesitate to contact us. Data cleaning is one of the many services Boxplot can provide for your business.<< Previous Post
"Are Decision-Makers Disempowered by the Modern Data Stack?"
Next Post >>
"Data Hour (September)"
