Telecom Excel Dashboards
Sensitive information has been blurred or removed.
These dashboards involve analysis of KPIs and finances/spending for a consortium of telecom companies, and were generated in Excel. We can also deploy visualizations directly to the web instead of using static images from Excel/reports.
This group created their own KPI and spending sheet in Excel, but was having difficulty with getting the formulas, formatting, and visualizations to work. Some of the formulas required were complex and involved a significant amount of logic. We were able to clean up the data, implement the formulas, and then visualize the results so that this group could have critical information at their fingertips.
All dashboards are made in Excel (yes, you can remove the grid background in Excel). Consider watching the videos to also see the dynamic nature of the dashboards. We added a slicer feature to a few dashboards so the companies could "slice and dice" the data as desired for different views.
Is your organization looking to create Excel visualizations/dashboards, or utilize its telecom/call center data? Chat with us about options:
Company Comparison Dashboard
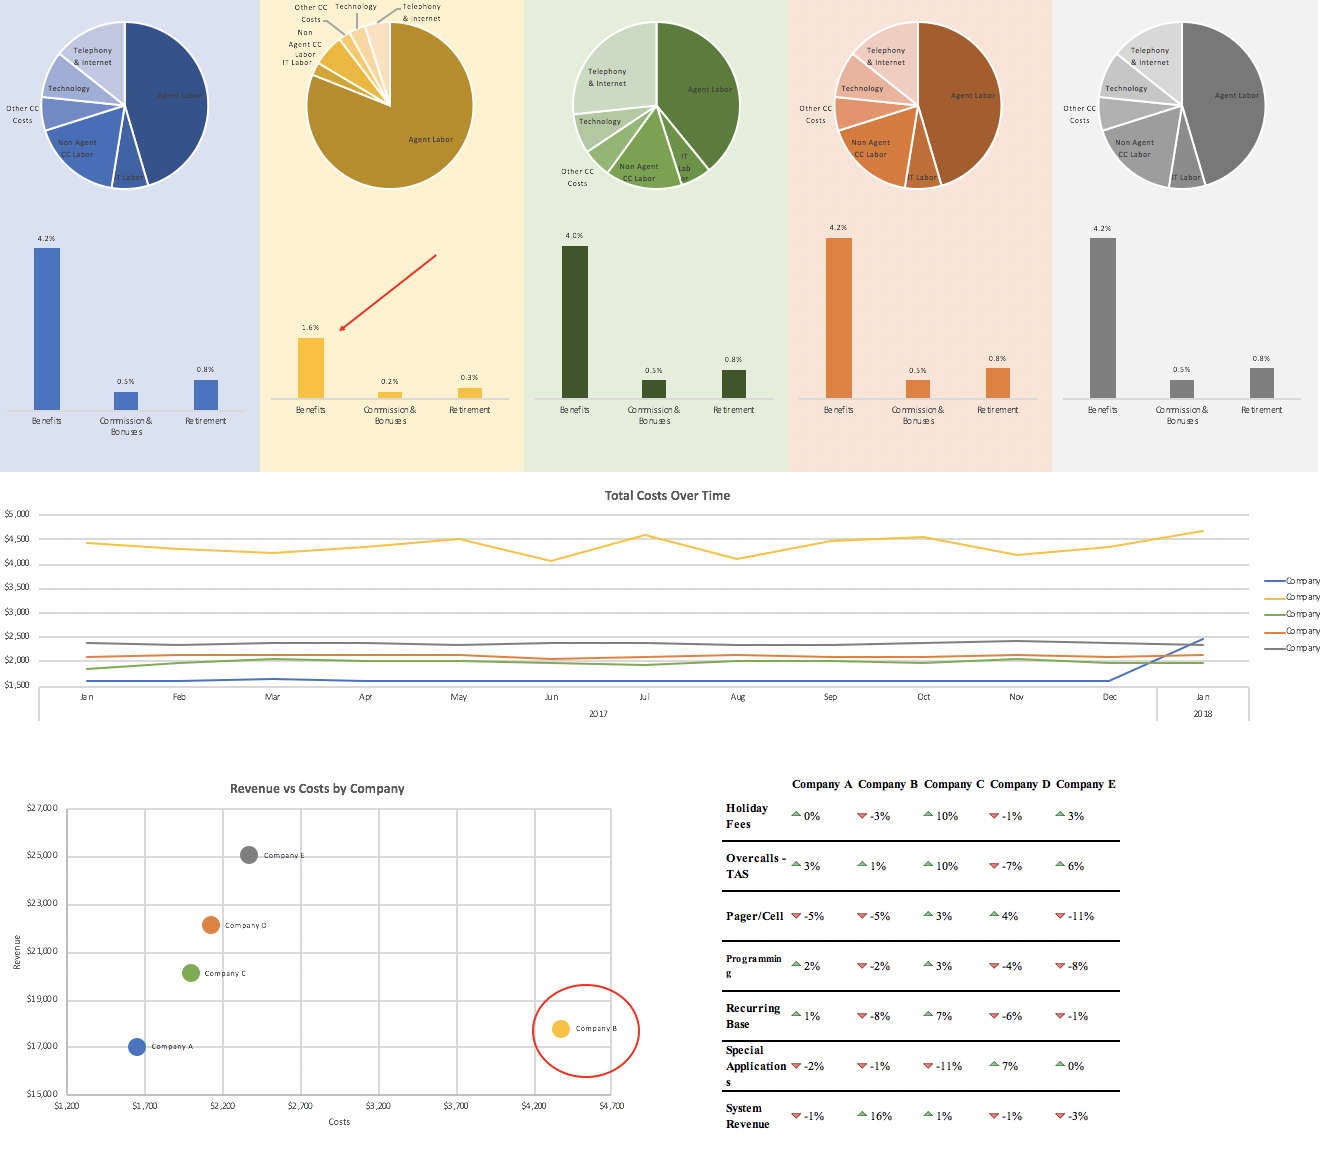
Caption: This is a screenshot of the company comparison dashboard. It compares key metrics for the five companies in the consortium. Besides calling out particularly interesting findings with arrows and highlights in our dashboards, Boxplot also explains all insights directly with clients as part of our consulting process.
Individual Company Dashboard
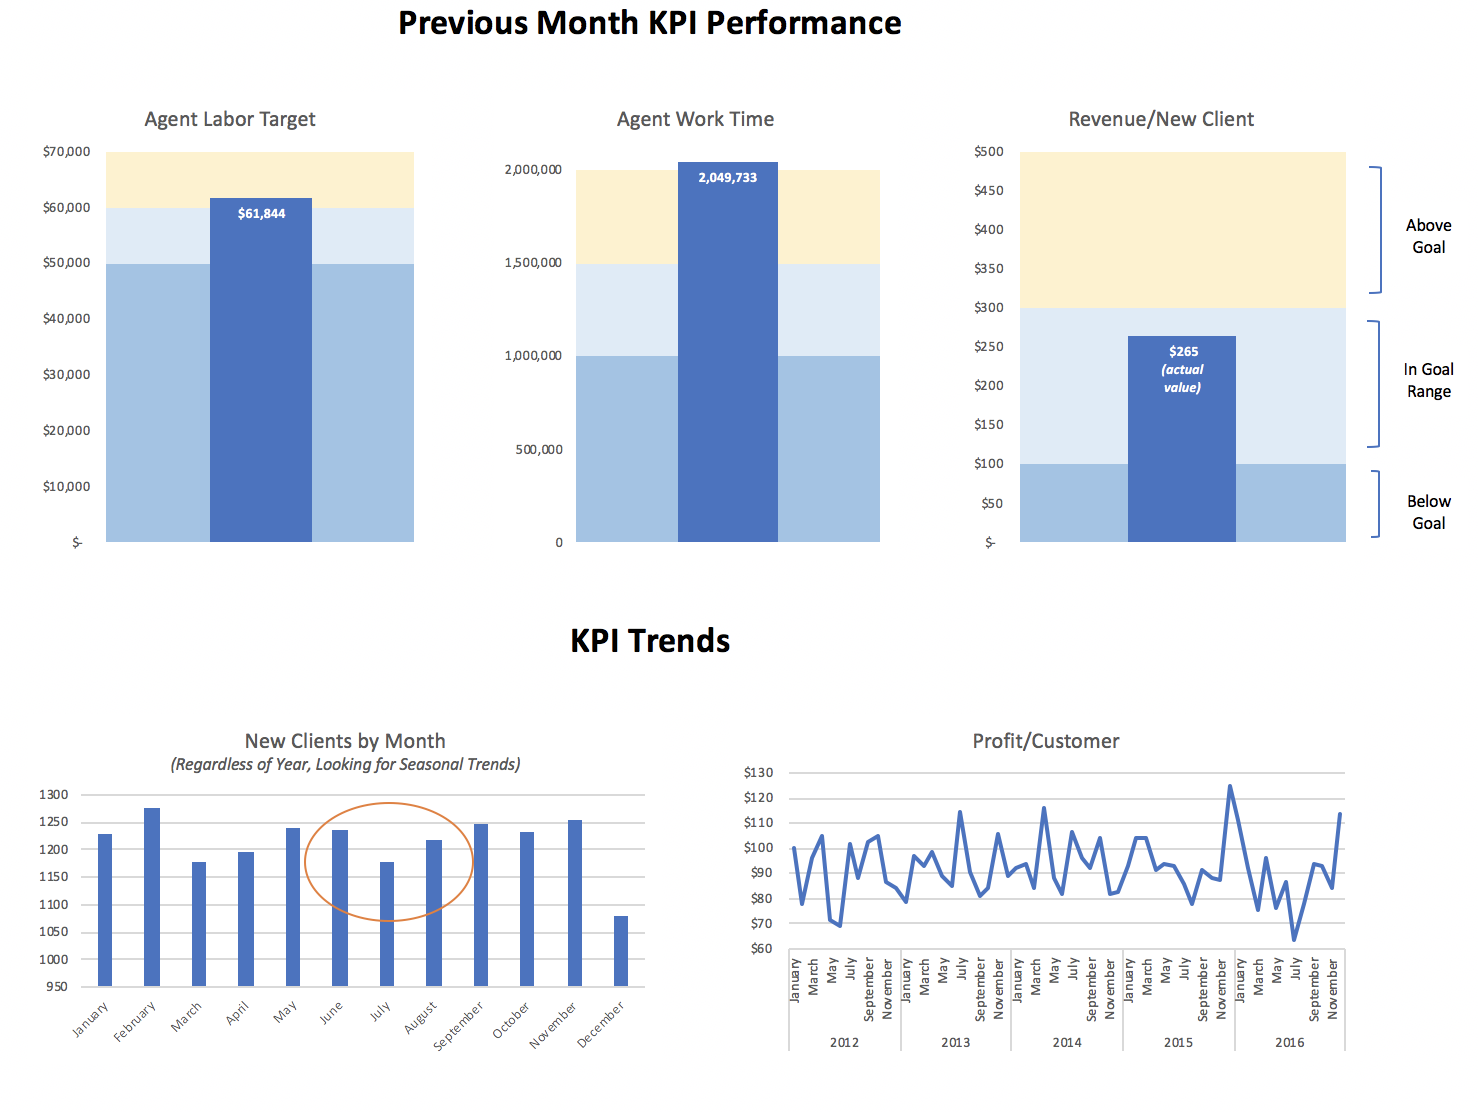
Caption: The following two dashboards are drilled down more - the first displays overall metrics for an individual company, and the second covers specific KPIs that were important to the client.
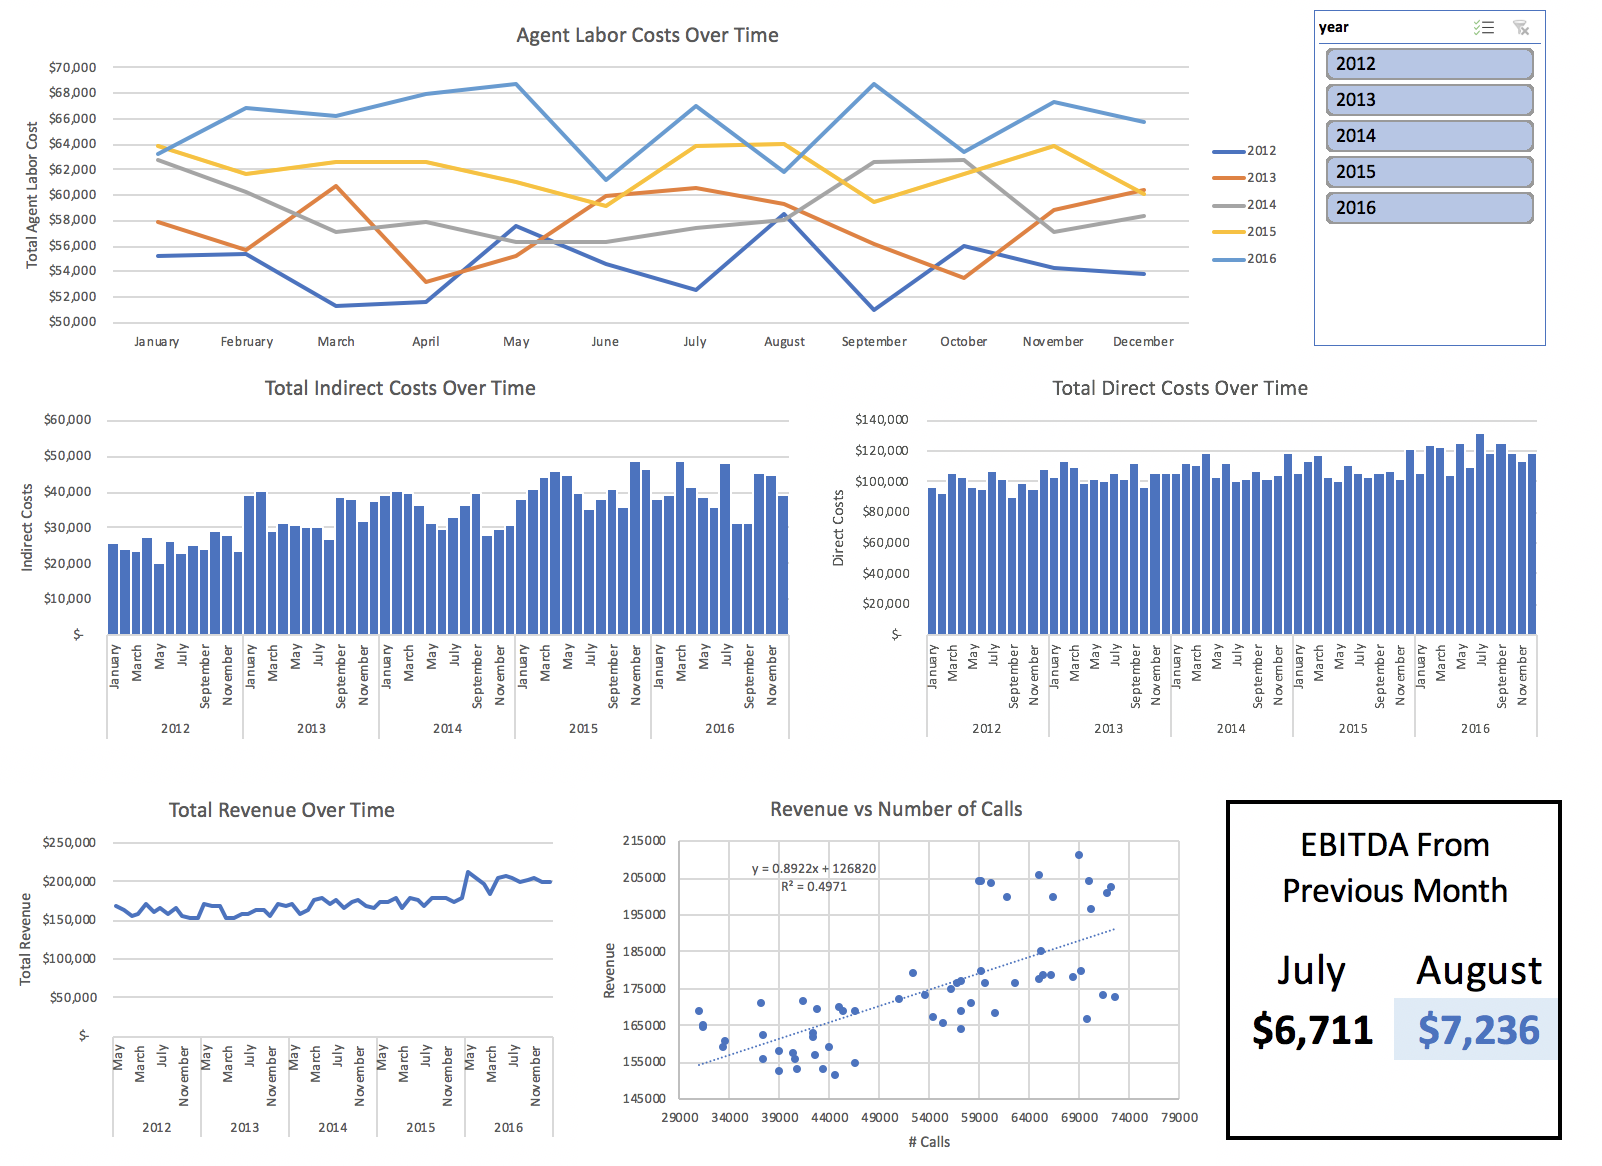
Caption: Per client request, we made the dashboard interactive. The client had the ability to slice the entire thing by year to view how trends changed year-to-year.
KPI Dashboard