Categories
Choose a category, or scroll down for all posts.
Data Analytics | Excel | Git | News | Python | SQL | Statistics | Uncategorized | Webinars
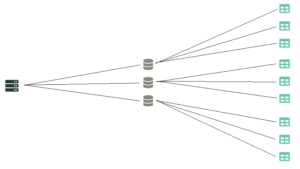
Unconventional Visualizations – Network Diagram
April 24th, 2024 by BoxplotSometimes, we need to think outside the box for data visualizations! This is a visualization we did using a little-known tool called Kumu. It was for a nonprofit gardening project – they needed a way to visualize information about companion planting from a book. The book laid out the information linearly – for example, “x […]
Pulling Data Via An API In Python
February 17th, 2024 by BoxplotWhat Is an API? An API, or Application Programming Interface, is a powerful tool that enables organizations to access and interact with data stored in various locations in real time. In other words, APIs allow different computer programs to communicate with each other seamlessly. For example, your business may have accounting software, a CRM, a […]

How B2B organizations can use their data
November 25th, 2023 by BoxplotB2B organizations possess a unique advantage when it comes to leveraging data. Data on their institutional clients is often readily available. Some of the most valuable data-driven outcomes for B2B organizations include sector analytics, both retrospective and predictive, prospect analytics, and automated data cleaning. In this blog post, we’ll explore how B2B organizations can gain […]

A/B Testing Example (Two Mean Hypothesis Test)
November 4th, 2023 by BoxplotA/B testing (sometimes called split testing) is comparing two versions of a web page, email newsletter, or some other digital content to see which one performs better. A company will compare two web pages by showing the two variants (let’s call them A and B) to similar visitors at the same time. Sometimes, the company […]

What Is Python, And Why Is It Awesome?
November 3rd, 2023 by BoxplotWhat is Python? Python is a relatively intuitive, general-purpose programming language that allows users to do anything from analyzing data to building websites. In the context of data, it allows for complete flexibility and customizability when performing analyses. Here are some good resources that dive deeper into what Python is if you are interested: https://www.coursera.org/articles/what-is-python-used-for-a-beginners-guide-to-using-python […]

Github Tutorial
October 16th, 2023 by BoxplotWhat Is GitHub And Why Is It Useful? GitHub is the world’s most commonly-used code hosting/storage platform. It is used by coders of all sorts to view, store, write, and collaborate on code, all for free. GitHub uses a tool called Git to enable these abilities (i.e., “GitHub” refers to the website where code gets […]
Excel Templates for Data Analysis
July 17th, 2023 by BoxplotWhen working in Excel, no one likes to start their analyses from scratch every time. Instead, data analysts can sometimes enhance the efficiency of their work by using templates for Excel tasks that they would otherwise complete manually. These templates give analysts all the intuitiveness that Excel offers while enhancing the ease and speed with […]

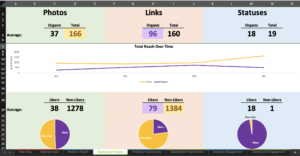
Small Business Social Media Metrics
April 23rd, 2023 by BoxplotA superior social media analytics practice is one of the best ways for small businesses to gain an edge over larger competitors. And the growing accessibility of advanced analytical tools makes social media analytics a worthwhile pursuit even if on a tight budget. This blog post covers some of the most useful social media-specific metrics […]
Line Graphs
April 1st, 2023 by BoxplotWhat Is A Line Graph? A line graph is a series of data points on an x–y axis, connected by a line. There are two kinds of line graphs: colored-in (also known as area charts) and standard. While the area under the line of a colored-in line graph is shaded in, the area under a standard line […]
Tips For Building Likert Surveys
April 1st, 2023 by BoxplotLikert Surveys ―pronounced LICK-ert― are one of the most popular ways of collecting survey data. Their simple design of providing a series of prompts with a discrete scale of responses for each prompt (such as “Strongly Disagree”, “Disagree”, “Neutral”, “Agree”, and “Strongly Agree”; “Poor”, “Fair”, “Average”, “Good”, and “Excellent”, etc.) makes Likert Surveys an extremely popular […]
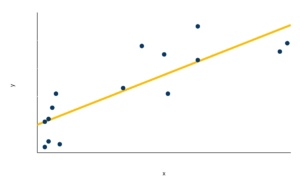
Interpreting Linear Regression Results
April 1st, 2023 by BoxplotA Brief Introduction To Linear Regression Linear regressions discover relationships between multiple variables by estimating a line or other function of best fit to a set of data. For example, the orange line is what a linear regression’s result would look like for the data shown in blue: This function of best fit (shown here […]

How B2C Businesses Can Use Their Data
March 20th, 2023 by BoxplotIn order to understand your customers fully and correctly, the data and analytics you maintain about those customers are extremely important. For B2C organizations especially ―which sell directly to customers― customer data and analytics are a necessary component of sales, marketing, and managerial strategies for both pre- and post-market decision making. There is a long […]
Conditional Formatting with Excel
March 18th, 2023 by BoxplotConditional formatting is an Excel feature that allows users to customize the formatting of a single cell or group of cells based on whether a certain rule is satisfied. This feature is extremely useful in terms of automation, because the formatting of the selected cells changes automatically if the chosen condition is no longer satisfied […]
Histograms
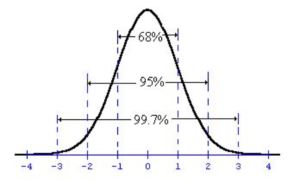
March 12th, 2023 by BoxplotA histogram is a type of bar chart that shows the distribution ―i.e., the probability of a variable being within a certain range of values, out of all possible values― of a certain variable. For example, we can use a histogram to show customer wait times at a restaurant: This histogram indicates that approximately 4 […]

Boxplot Makes List of 64 Best Pennsylvania Database Startups
April 29th, 2022 by BoxplotThis month, April 2022, Boxplot was listed as one of Pennsylvania’s best database startups. Startup Pill is an online international resource for startup founders, investors, and consultants. The companies on this list were selected based on innovation, growth, management, and social impact. Take a scroll through their article to see our feature! About Boxplot Boxplot […]
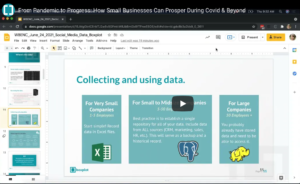
WBENC Social Media Presentation
September 19th, 2021 by BoxplotWatch the Webinar View the text for the video In June 2021, Barb was a guest speaker for the WBENC webinar series: From Pandemic to Progress. This webinar is geared towards small business owners who want to analyze their company’s social media data to use it for their advantage. The webinar goes into detail from […]
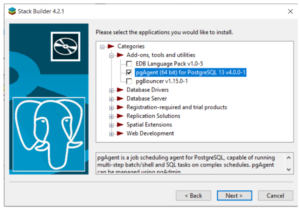
Setting up PostgreSQL & pgAdmin
July 4th, 2021 by BoxplotWhat’s the difference between PostgreSQL and pgAdmin? PostgreSQL is a free-to-use relational database management system (DBMS); pgAdmin is a graphical user interface (GUI) tool that lets users interact with their PostgreSQL database(s). In other words, PostgreSQL is the actual database system, and pgAdmin is a tool that lets users use that system. How do I […]
Data Hour (September)
June 10th, 2021 by BoxplotWatch the Webinar Barb returns to PowerToFly as a guest speaker in the “Data Hour” webinar. The first half of this “Data Hour” webinar consists of answers that Barb has for some general and more specific data analysis-related questions that the audience has. Some of the audience questions in this webinar include: “What is the […]

PivotTables in Excel
February 1st, 2021 by BoxplotWhat is a PivotTable? A Pivot Table is an analytics tool that can quickly answer key business questions. They are excellent at extracting insights from a vast dataset quickly. PivotTables are one of the most efficient and effective ways to evaluate large quantities of data in Excel. By “pivoting” or aggregating a large data table […]

Are Decision-Makers Disempowered by the Modern Data Stack?
September 23rd, 2020 by BoxplotFuture Data 2020 Many winter moons ago, I (virtually) attended Future Data 2020, a conference about the next generation of data systems. During the conference, I watched an interesting talk given by Tristan Handy, founder and CEO of Fishtown Analytics, called The Modern Data Stack: Past, Present, and Future. During the talk, Tristan discussed a so-called […]
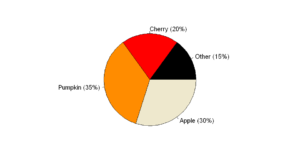
Pie Charts
September 4th, 2020 by BoxplotShow/Hide Code Introduction It seems as if people are split on pie charts: either you passionately hate them, or you are indifferent. In this article, we are going to explain why pie charts are problematic and, if you fall into the latter category, what you can do when creating pie charts to avoid upsetting those […]
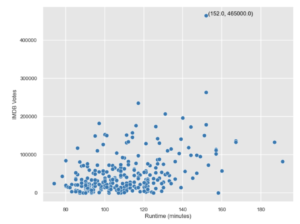
Scatter Plots: What they are and how to make the most of them
August 21st, 2020 by Boxplot
Protected: Wording Surveys Well Makes Them More Effective: Part 4
June 18th, 2020 by BoxplotThere is no excerpt because this is a protected post.

Protected: Wording Surveys Well Makes Them More Effective (Part 3)
May 13th, 2020 by BoxplotThere is no excerpt because this is a protected post.

Protected: Wording Surveys Well Makes Them More Effective (Part 2)
April 24th, 2020 by BoxplotThere is no excerpt because this is a protected post.

Protected: Wording Surveys Well Makes Them More Effective
April 15th, 2020 by BoxplotThere is no excerpt because this is a protected post.
Intro To SQL
November 22nd, 2019 by BoxplotWatch the Webinar PowerToFly has Barb on as a guest speaker in the “Intro to SQL” webinar. In this webinar, Barb answers various questions regarding SQL including: “What is SQL?”, “What kind of jobs use SQL?” and “What is a SQL query and what do I need to make one?”, followed by more specific questions […]
Useful Python Snippets
October 26th, 2019 by BoxplotThe goal of this blog post is a compilation of little tidbits and code snippets that address common issues when programming for data analysis in Python. General Snippets Difference between JSON and XML This page gives a great example of the difference between data in JSON format and XML format. It shows the exact same […]
A/B Testing Example (Two Proportion Hypothesis Test)
September 25th, 2019 by BoxplotA/B testing (sometimes called split testing) is comparing two versions of a web page, email newsletter, or some other digital content to see which one performs better. A company will compare two web pages by showing the two variants (let’s call them A and B) to similar visitors at the same time. Typically, the company […]

Population Mean Hypothesis Test Example
September 25th, 2019 by BoxplotThe Situation: Kakes+, a Pennsylvania company that makes terribly unhealthy small pies/cakes, believes that their machines are overfilling their blueberry pies. Kakes+ wants to test this statistically, and has recruited you to come up with a data-backed answer. The pies should weigh 8 ounces each. Step 1: Collect Data You need to weigh the pies […]
Common Python Errors
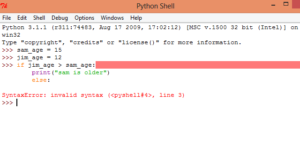
September 1st, 2019 by BoxplotThis post is updated as appropriate, so keep checking back! Table of Contents Errors when installing python with homebrew Error: Permission denied Error: Could not symlik bin Errors when writing/running python code TypeError NameError IndentationError SyntaxError IndexError KeyError ValueError Installing Python Error: Permission denied @ dir_s_mkdir – /usr/local/Frameworks Check out this article for help: https://github.com/Homebrew/homebrew-core/issues/19286 […]
Tables & Linking Data Structures in Excel
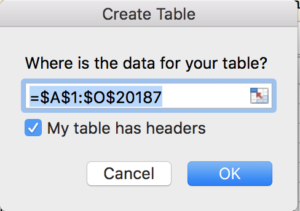
September 1st, 2019 by BoxplotTables are one of the most important features of Excel, but are often overlooked. Tables and keeping analyses in Excel connected, will drastically increase your efficiency in Excel. Let’s start by understanding how they work with PivotTables. We’re going to use an R Dataset called DoctorContacts. Download the .csv file using this link (and save […]
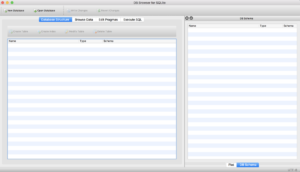
Using DB Browser for SQLite
September 1st, 2019 by BoxplotDB Browser for SQLite (it’s also called SQLite Browser for short) is an excellent tool for practicing SQL without having to get connected to a real live server. This post will walk through how to install, open, and use SQLite Browser. Install SQLite Browser Go to the SQLite Browser website and choose the download for […]
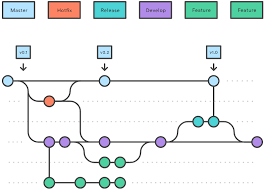
Git Resources
September 1st, 2019 by BoxplotResources for Learning Git Atlassian’s GitFlow Page This is a short tutorial article focused on a typical Git sequences. try.github.io A list of Git Resources, broken down by type.
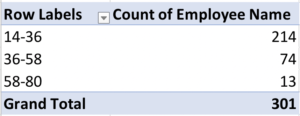
Grouping in PivotTables
September 1st, 2019 by BoxplotGrouping in PivotTables is a way of combining data to perform analyses without having to use functions. You can group numeric columns to turn them into categories, you can group date columns by date ranges to get even intervals, and you can group text columns to put together similar values. We’ll go through all three […]
Installing & Running Jupyter Notebook
September 1st, 2019 by BoxplotStep 1: Install Anaconda Go to this download webpage on Anaconda’s site. Choose the correct link for your operating system, and then go through the installation process. Step 2: Prepare a folder for notebooks Choose or create a folder on your computer where you will store all Jupyter notebook files. Make sure you choose a place […]
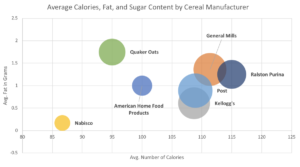
Make a Bubble Plot in Excel
September 1st, 2019 by BoxplotMost people don’t know that bubble plots even exist in Excel. In this blog post, we’ll walk through how to take advantage of these very effective charts! They are great for comparing three quantitative variables at once. For a nice intro to bubble plots, check out Hans Rosling’s very famous Ted Talk. If you don’t […]
Python Resources
September 1st, 2019 by BoxplotPython Resources Driven Data This is a great way to tackle Machine Learning and Python at the same time! I also like Driven Data because it’s a project with a specific goal. I think that’s the best way to learn! Automate the Boring Stuff with Python This is another project-based site that also is […]
Understanding JOINs in SQL
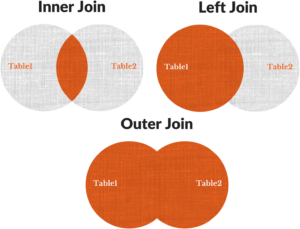
September 1st, 2019 by BoxplotJoins in SQL Joins are one of the most important (if not THE most important) concepts in SQL. If you take the time to solidly understand how joins work, you’ll be in an excellent place for writing queries. So, let’s dive in! Join Definitions Joining tables in SQL is a way of combining them. It […]
Understanding Multiple JOINs in SQL
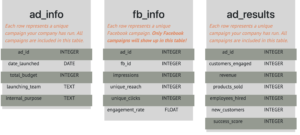
September 1st, 2019 by BoxplotMultiple joins are one of the toughest SQL concepts – in this post we’ll decode them and review some common pitfalls. One of the best ways to learn is with an example. If you’d like to follow along, you can download this zip file that contains the three tables as .csv files here, and import […]
Free Datasets
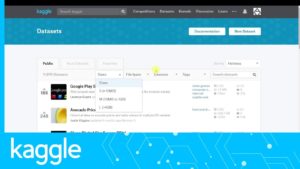
September 1st, 2019 by BoxplotA list of freely available data on the web. The first list is sites we think are the best for accessing quality datasets. Below that are additional sources by category. Best Sources Kaggle By far our personal favorite! There are dozens if not hundreds of quality datasets available here. ICPSR You have to create an account, […]
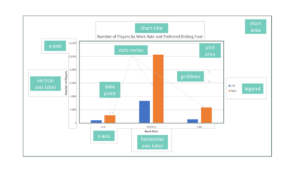
Formatting Charts in Excel
September 1st, 2019 by BoxplotFormatting charts in Excel is no easy task. It’s time-consuming, and Excel is pretty fussy which doesn’t make things easier. In this post I’ll give general tips for formatting charts, and also go over a few common scenarios. Understand the Parts of a Chart First thing’s first: it’s important to get the syntax down pat […]
Excel File Setup for Analysis
September 1st, 2019 by BoxplotExcel gives you a lot of flexibility when creating files and starting projects, and we’re often asked what the “best” solution is for keeping things organized. This post will review what we recommend. As with everything in life, there may be a few exceptions where you’ll want to set up your file differently. However, this […]
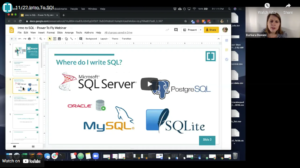
What is SQL?
August 31st, 2019 by BoxplotWhat is SQL? Currently, if you Google this question, you’ll get a whole slew of technical articles that aren’t very helpful for understanding just what SQL is and when people use it. We’ll break that down in this blog post. This is a high level overview – if you want to understand how to actually […]

Data Hour (July)
July 25th, 2019 by BoxplotBarb returns to PowerToFly as a guest speaker for another “Data Hour” webinar. This “Data Hour” webinar consists of answers that Barb has for some general and more specific data analysis-related questions that the audience has. In this webinar, Barb answers many questions about data visualisation such as some of her favorite tools for compiling […]
Data Chat
April 4th, 2019 by BoxplotBarb returns to PowerToFly as a guest speaker, this time, for a “Data Hour” webinar. This webinar consists of answers that Barb has for some general and more specific data analysis-related questions that the audience has. What’s unique about these Data Hour webinars is that audience members are able to get specific answers to questions […]
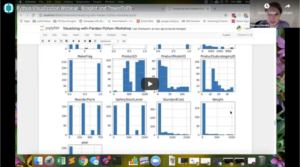
Data Visualization in Python Lunch + Learn
February 20th, 2019 by BoxplotData analytics expert, Barbara Donnini, joins PowerToFly as a guest speaker for a Python Visualization Seminar. This interactive seminar combines Python, Jupyter, and Pandas and focuses on visualizing and plotting. Some tasks that audience members learn throughout the course of this webinar include: importing and loading data and coding line plots, bar plots, histograms, scatter […]
100th Anniversary of Variance
December 28th, 2018 by BoxplotThis year (2018) is the 100th anniversary of a paper by R. A. Fisher, which introduced the statistical term “variance”. Variance is one of the toughest concepts in statistics, but it’s crucially important. Variance tells you how spread out your data are (yep, “are”; the word “data” is plural!). First, let’s get some terminology out of […]
